I learned about that not all graph may be suitable to display certain information. There is a need to choose the appropriate graph to put in a dashboard. Also display the suitable kind of information on a dashboard whether it is text, graphics or both and organising the dashboard.
Below are some useful links:
This link shows the effective widgets that can be displayed on dashboard, also what are the common types of dashboard design.
http://www.tdwi.org/research/display.aspx?ID=7487
This link shows an example of a dashboard and commented on the good and bad of it.
http://www.dashboardzone.com/bad-dashboard-design
This link is the book that tells on the bad designs of dashboard and the graphs shown were also used in our lab exercise.
http://books.google.com.sg/books?id=XqvYS6KGFKEC&pg=PT59&lpg=PT59&dq=bad+dashboard+design&source=bl&ots=vnviJu0h-i&sig=PpHdi8Yxjq2CB6EF6CwWQalt6bo&hl=en&ei=x04qS5_kGMqLkAW-w4T2CA&sa=X&oi=book_result&ct=result&resnum=8&ved=0CCgQ6AEwBw#v=onepage&q=bad%20dashboard%20design&f=false
Thursday, December 3, 2009
Tuesday, December 1, 2009
Week 5
This week I learned about the different types of visualisation that are useful for developing graphs and dashboard. The different visual attributes that can help us differentiate or highlight the important information in the dashboard at one glance.
Here are some of the useful links that guide us to have an appropriate dashboard:
http://www.enterprise-dashboard.com/2008/07/17/4-bi-worst-practices/
http://www.enterprise-dashboard.com/
http://dashboardsbyexample.com/
http://searchdatamanagement.techtarget.com/generic/0,295582,sid91_gci1362732,00.html
Wednesday, November 18, 2009
Week 4
I learned about the different designs of Data warehouse: Star schema, snowflake schema and constellation schema. Also the different types of OLAP cube: ROLAP, MOLAP and HOLAP.
The software available for Data warehouse is Oracle Data Warehousing:
http://www.oracle.com/us/solutions/datawarehousing/index.htm
Below are websites that gives detailed information on the different OLAP cubes:
http://www.1keydata.com/datawarehousing/molap-rolap.html
http://www.geekinterview.com/question_details/271
I also learned that there is another type of OLAP cube called the DOLAP which is Desktop Online Analytical Process. The OLAP that communicates with Desktop Databases to retrieve the data.
Tuesday, November 10, 2009
Week 3
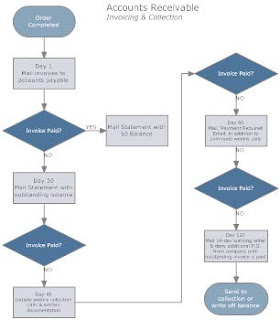
I learned that developing dashboard is not as simple as just putting different graphs in a single screen, it needed important steps to put in those necessary and crucial information. I also learned to create process map which is a guide to help me understand the flow of a single process in a company or any scenario. Six sigma helps in creating the process mapping.

The video tell me what and how six sigma is being implemented:
The video showing how to draw a process map:
There are also process map software available on the internet:
Graham Process Mapping 7.0 -> http://www.processchart.com/

SmartDraw Process Mapping -> http://www.smartdraw.com/specials/process-mapping.htm

Thursday, October 29, 2009
Week 2
This week I learned about building a balanced scorecard which helps to address a company's theme. It gives a very clear summary of how the company is doing and what are the things that needed to be highlighted.
http://www.balancedscorecard.org/BSCResources/ExamplesSuccessStories/tabid/57/Default.aspx
The above link shows examples of organisations working with balanced scorecard which includes non-profit organisation and government organisation.
Examples of Balanced Scorecard softwares:
QuickScore Performance Information System
CorVu
Actuate/Performancesoft
QuickScore Performance Information System is developed by Spider Strategies and co-marketed by the Balanced Scoredcard Institute.
CorVu produced the software called "CorStrategy" and it efficiently execute strategic plans using automating methodologists such as the Balanced Scorecard etc.
Actuate automates Balanced Scorecard facilitates effective communication and implementation of goals, while delivering the focus needed for alignment to top level strategy.
Saturday, October 24, 2009
Week 1
Business Intelligence is expanded from Data Mining so I hope BI lesson will help me have a better understanding on Data Mining. For my first lesson, it is a refreshment of what I have learned in Data Mining and focused more on data visualisation which I noticed in the lecture notes.


Below are example of BI software available for business purposes:
MicroStrategy

Tableau

SAS

Useful links:
Subscribe to:
Comments (Atom)